In the NHL, save percentage is a team stat

Original Source: CHRIS BOYLE
Posted on: Jun 03, 2015
An article written earlier this season (November 2014), it explains well how keeping goals against down isn't just on the goalie! Analytics have gained more and more popularity this year and rightly so! We enjoy everything goaltending, this article really is interesting!
------
Once again Monday, a goaltending coach was scapegoated for a team’s perceived poor netminding. But does anyone really believe that Frederic Chabot was the reason the Edmonton Oilers have the NHL’s worst team save percentage? For that matter, are Ben Scrivens and Viktor Fasth even to blame?
The goaltending position continues to be misunderstood. Goalies have one job: Remain as square to the puck as possible. They can control their reads, decision making and movements to the puck to beat the pass and make the save—or solve the equation—but have zero control over the difficulty of the equations thrown their way. That’s why I am never surprised by radically fluctuating save percentages; I believe that environment influences numbers.
One issue I take with analytics is the notion that large samples solve everything. That doesn’t makes much sense. It assumes that over the past four or five years, a netminder on the Bruins (with Zdeno Chara) has seen the same scenarios as a goaltender on the Islanders. Or that if Chris Kunitz played with Tyler Bozak instead of Sidney Crosby, he would produce at the same rate because the larger sample evens out. Nobody believes that, yet without any reasonable explanation, it is a common assumption in analytics that Tuukka Rask is 10-to-12 goals better than Carey Price per 1,000 shots.
That is the level of analysis we are currently seeing. I touched on this peripherally last season when looking at Pat Burns and other defensive oriented coaches. During his Montreal/Toronto years, Burns consistently harped on controlling the neutral zone. Turn the puck over at a blueline and you would find yourself in big trouble.
The New Jersey Devils under Jacques Lemaire were also consistently disciplined in that highly influential patch of ice. Strong save percentages followed those two coaches around. With the current focus on zone exits and entries, and their link to better opportunities when teams cannot force dump-ins, it makes sense that the neutral zone was so important to those coaches.
The idea that zone entries influence offence/defence/possession is backed up by the data. It doesn’t matter if the x,y co-ordinates are correct or not, it's a fact that more shots are created on controlled entries versus dump-ins. Zone entries are also linked to shot quality. If a team can control the neutral zone, excel at zone exits to negate efficient forechecks and limit controlled entries, it should be able to stifle offence.
Can a team do this consistently in a large enough sample to limit its opponents' offences and in turn inflate its own goaltenders' save percentages? Yes. Case in point: the Boston Bruins.
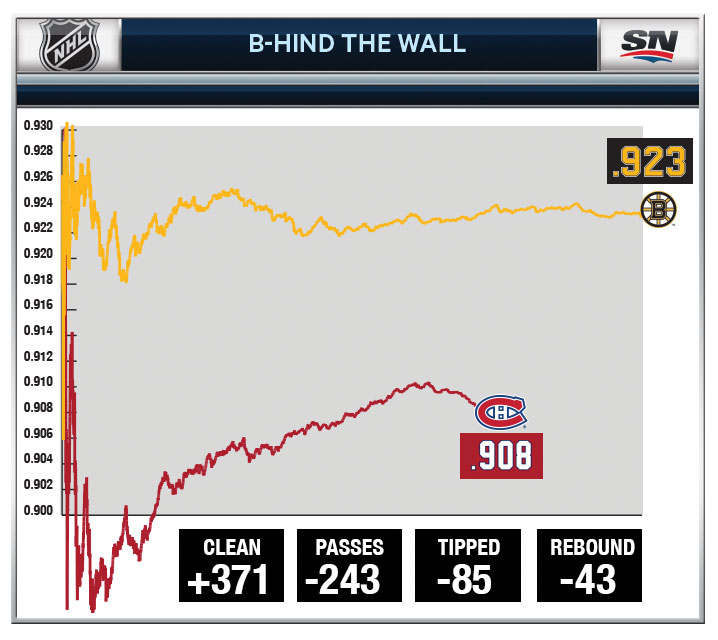
I tracked three full Bruins seasons—every shot faced from the 2011-12 through '13-14 by Tim Thomas, Chad Johnson, Anton Khudobin, Marty Turco and Rask. I also included Rask’s 2010-11 campaign. Over the 6,700-shot sample, the expected save percentage for an average Bruins goaltender was .923. The only sample I had large enough to compare was the Montreal Canadiens—a 4,800-shot sample of Carey Price, Peter Budaj and Dustin Tokarski. Their expected save percentage over the same period was .908.
Using the percentages and extrapolaying the shot totals to 6,700, the Bruins goaltenders over this sample would include almost 400 more clean shots—which have an expected save percentage of .949 rather than the .651 on shots preceded by a pass. Since 2008-09 the Bruins have maintained a .926 SV%. Plug in a goaltender and a .920-plus SV% shows up. Why? Because the baseline for average on the Bruins is not the league average of .914 it is actually .923.
When we look at the Bruins having an increased baseline average then we have to re-categorize their goaltenders. Instead of six goaltenders significantly above average, we have Rask and Thomas above average and Johnson, Khudobin and Svedberg average or slightly below. That's a more logical theory than every goaltender in Boston is really good. Price who is widely regarded as the blueprint for goaltenders, struggles to crack the league-average save percentage at .917, but if his baseline is .908 it passes the eye test for the most technically efficient goaltender I have ever seen.
Instead we are bombarded by a lack of understanding of a complex position simplified to one statistic—save percentage—that entirely ignores individual environment. Ondrej Pavelec gets off to a strong start and the talk turns to his adjustments and enhanced play instead of looking at how his environment has changed.
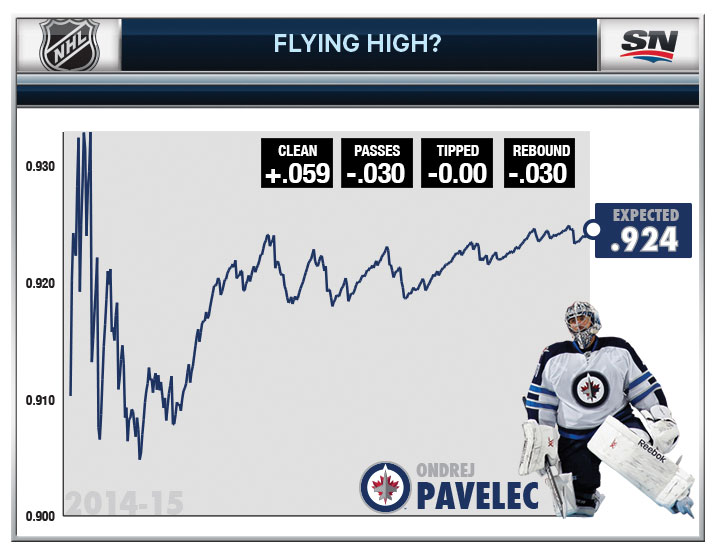
Simply put, 27-year-old goaltenders who over-pursue pucks and have struggled to keep up with the pace of play for 290 NHL games don’t adjust to the speed of the game over an off-season. However, their environments can be altered. Early in the 2014-15 season, more than 90 percent of the shots Pavelec faced were clean. My research indicates that he has an expected success rate of 95 percent on such opportunities. Previous data had his clean shots faced at 84 percent.
The changing environment theory is best exemplified by goaltenders who move from team to team. Ben Scrivens spent three seasons trying to establish himself as an NHL starter. Over a 6,000-shot sample in college, the AHL and ECHL, Scrivens registered a .928 SV%. Pre-Edmonton, he had a respectable .917 NHL SV% over close to 1,400 shots. During his small-sample stint in L.A., Scrivens led the league in save percentage. But since his trade to Edmonton he has cratered, posting a disastrous .905 SV% (.887 this season). And it's entirely environment based.
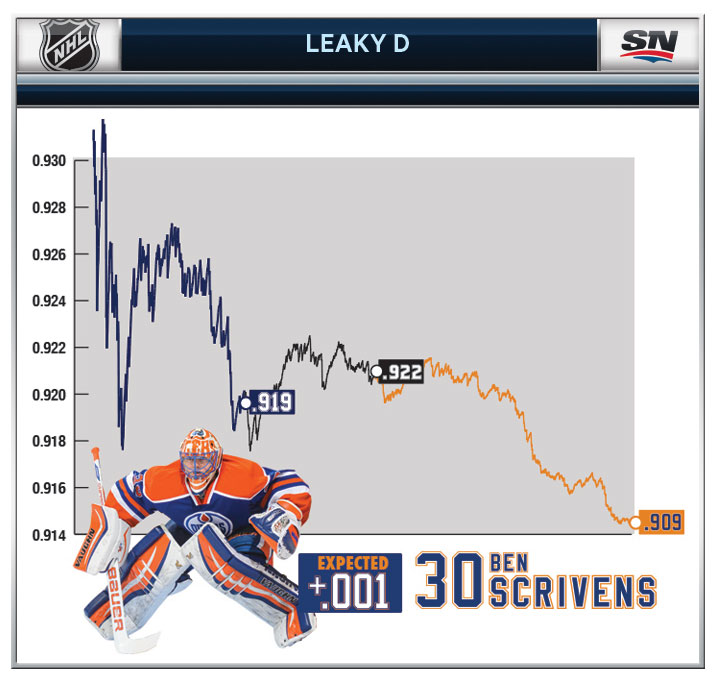
A the chart above shows, Scrivens is a respectable +.001 above expected save percentage for his career. But it also shows what's actually been expected on his different teams—922, .919, .909—and helps illustrate the massive difference in workload he has now compared to his first two NHL stops. Scrivens's career .957 SV% on clean shots coupled with the Kings' ability to limit high quality pre-shot movement opportunities was a perfect match of styles. Even in Edmonton, his save percentage on clean shots is +.011 above expected, but his exposure to high-quality opportunities in the form of cross crease passes has buried him. In Edmonton, Scrivens is facing 30 to 40 more difficult shots per 1,000 than he was in Los Angeles, or even Toronto.
Ultimately the Oilers' struggles cost goalie coach Frederic Chabot his job. But the real reason Scrivens's save percentage is below .900 is porous defensive zone coverage. When running the data for just 2014-15, Scrivens has an expected success rate of .903. Only 82 percent of the shots he has faced are ones in which he could set his depth and angle. The Bruins register 88 percent.
Scrivens spent close to a decade being above average before arriving in Edmonton, a team whose goaltenders have registered one season above league average since 2009-10. Eleven different netminders and the only ones above the Osgood line (league average) played three or fewer games. Only Devan Dubnyk (.910 to .909), Martin Gerber and Richard Bachman (who both faced fewer than 100 shots as Oilers) were better in Edmonton than elsewhere.
This is environment at work not goaltending ability. How is it possible to have any confidence when you can't stop pucks thanks to the impossible equations being thrown your way? Desperation can cause goalies to lose confidence in their process and start chasing the game. Instead of hanging in for shots, they cheat because they've lost trust in ther teammates. The same thing can benefit goalies in a controlled environment. Jonathan Quick and Tim Thomas use more aggressive depths because they're not concerned with backside pressure—they trust their teammates. It snowballs in both directions.
The goaltender market is full of misrepresented talent and is the perfect environment to identify market inefficiencies. Shot quality does exist in large samples. And soon, thanks to better and more camera angles, the data will be available to end the debate once and for all. With that, the inefficiencies on which most teams currently base their statistical models will disappear.
CLICK HERE to read original article